Compass Agent Finance Center
Overview
How Agents Work
At Compass, team-based operations dominate the real estate landscape. About 75% of agents operate in teams, with half of these teams having 5+ members. High-performing teams manage up to 140 transactions annually, creating complex financial tracking needs.
Current Financial Management
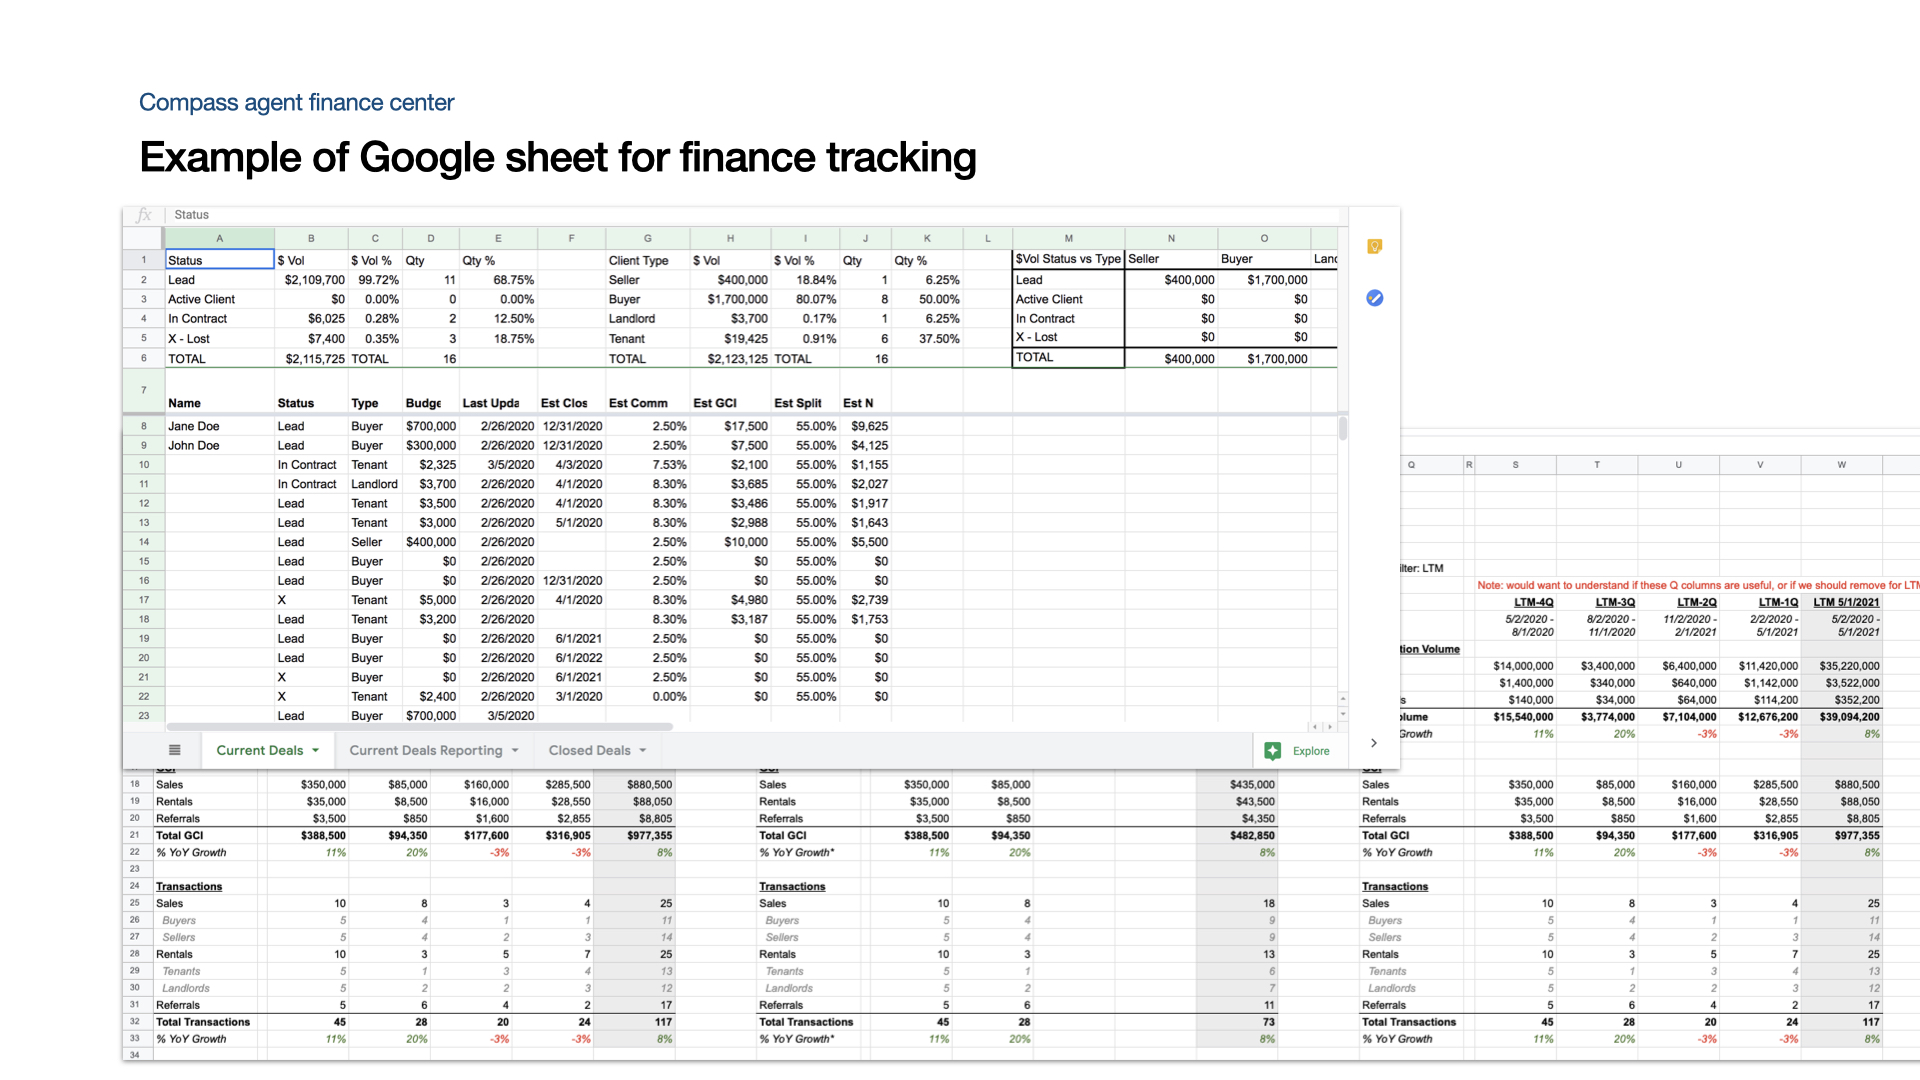
Real estate success heavily depends on effective cash flow management and P&L tracking. Currently, agents cobble together solutions using:
- Google Sheets and Excel for basic tracking
- Third-party tools like Knack and CT-tracker
- QuickBooks for accounting and tax preparation
Defining Problems
Customer Pain Points
-
Financial Tracking Challenges
- Manual data entry across disconnected systems
- Complex expense and mileage tracking for taxes
- Difficult commission split calculations
-
Team Management Issues
- Limited visibility into team performance
- Complex commission distribution tracking
- No centralized financial dashboard
-
Business Growth Barriers
- Reliance on external finance coaches
- No ROI tracking for investments
- Manual goal tracking and reporting
Product Goals
Core Objectives
- Provide comprehensive financial visibility for better business decisions
- Reduce manual data entry and reconciliation time
- Enable data-driven goal setting and tracking
Key Performance Indicators
- Reduction in third-party tool dependency
- Time saved on financial management tasks
- Platform adoption and engagement metrics
Research Insights
Primary Research
Conducted interviews with 15 agent teams across major markets (DC, NY, SF), ranging from solo agents to large teams.
Key Findings
-
Income Tracking
- Manual tracking is error-prone and time-consuming
- Quarterly summaries preferred over monthly views
- Deal type differentiation crucial for goal setting
- Need for source-of-income analysis
-
Team Visibility
- Different access levels required for team members
- Leaders need private access to team earnings
- Team members should only see their transactions
- Need for clear commission split visibility
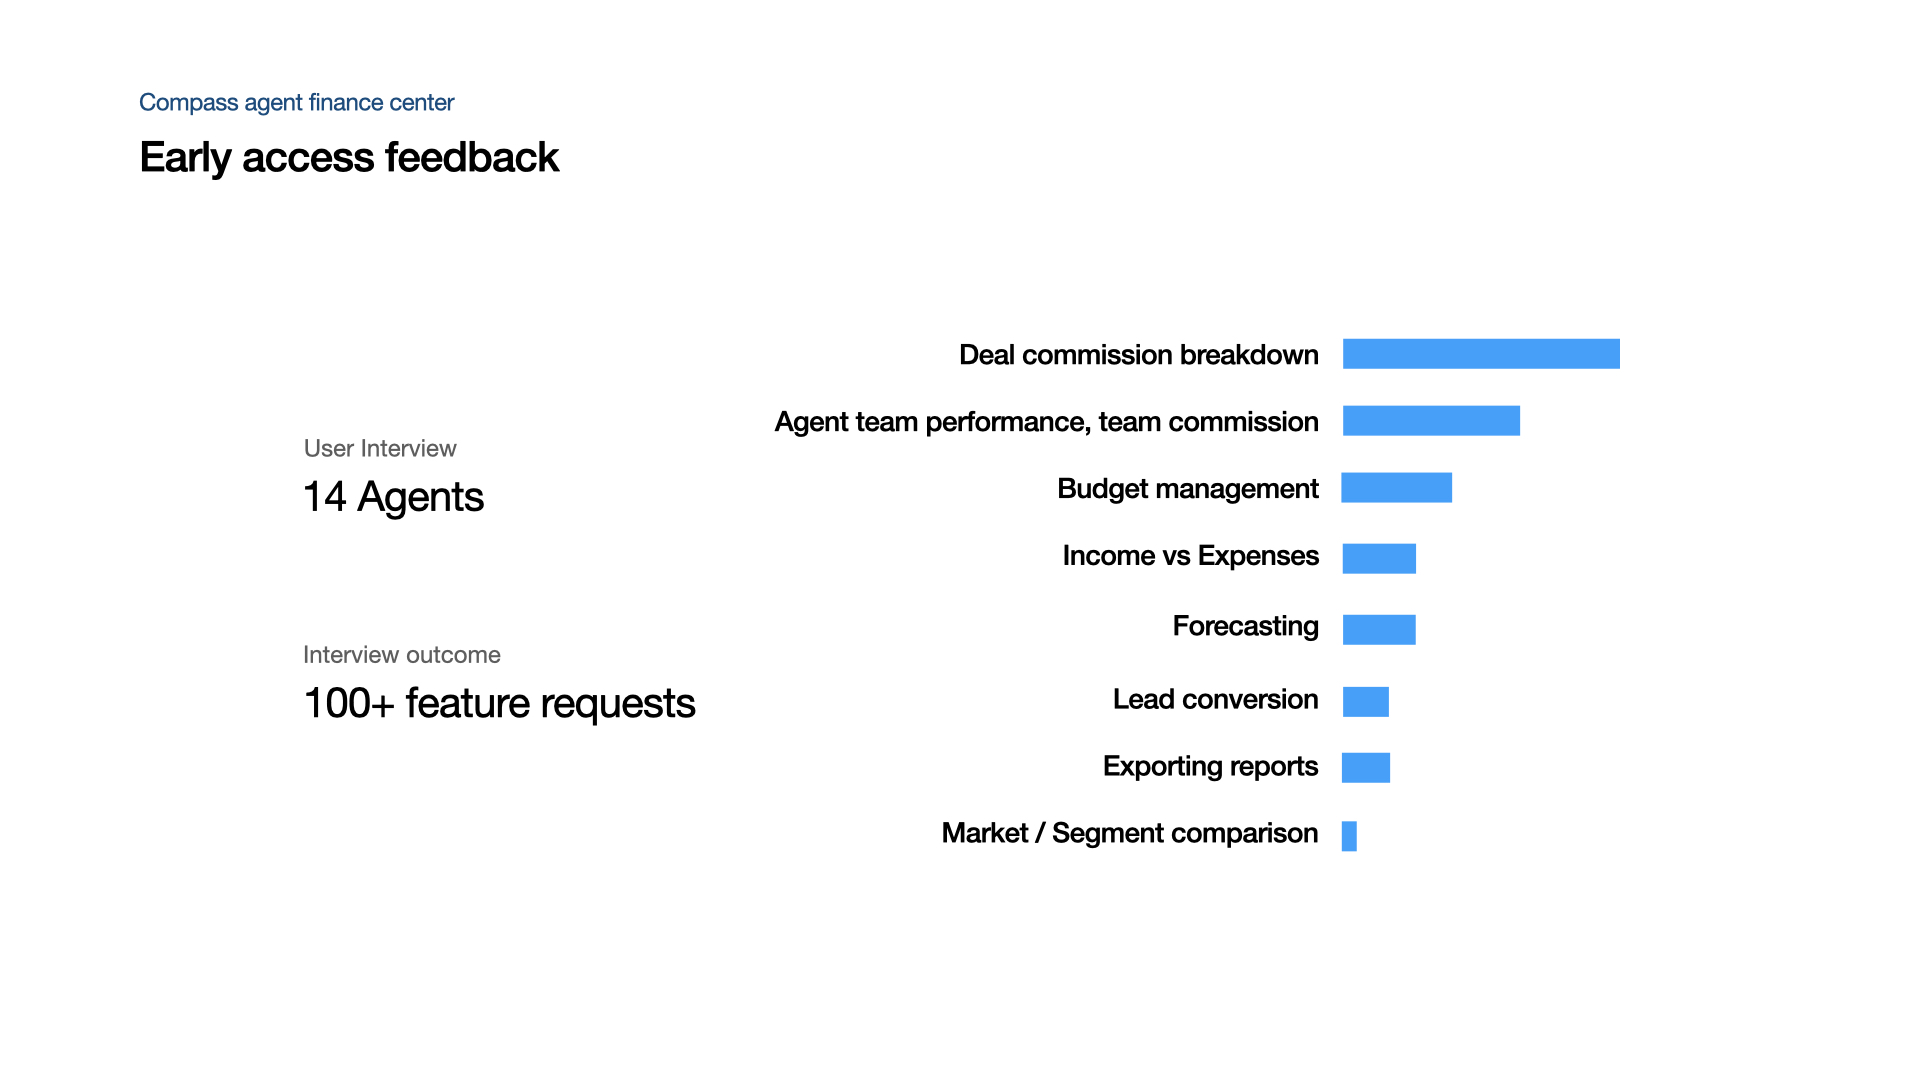
Early Access Feedback
Commission and Income Tracking
"It will be more helpful to include Commission After Split, Net Commission, Fees, and Payment Date"
"I could log into that portal and click and see how much net money I received on each deal and what the running total is so far."
Key requests:
- Clear display of net commission after splits
- Detailed fee breakdown
- Running total of earnings
- Payment date tracking
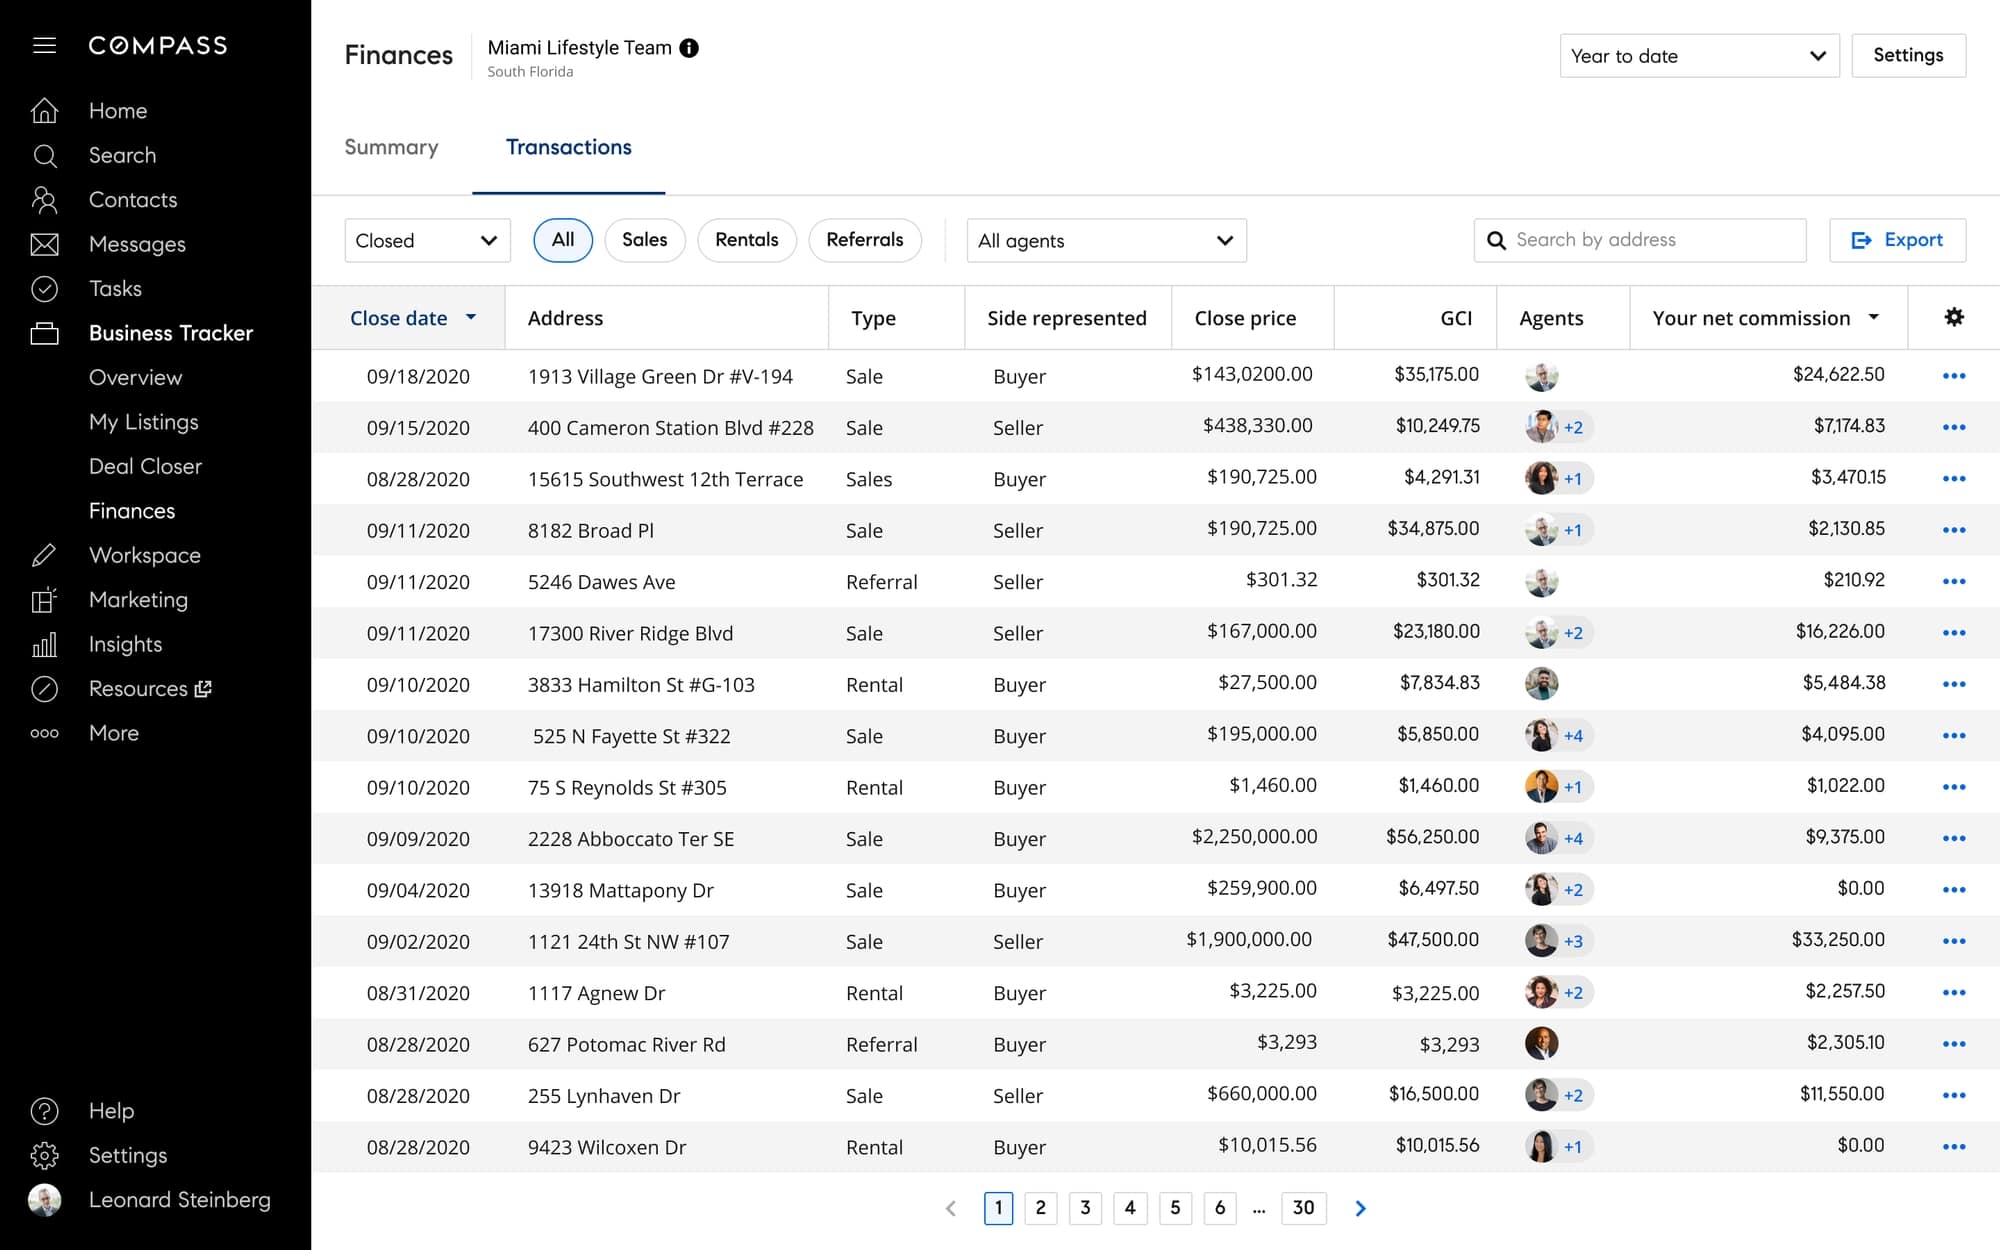
Team Performance Insights
"It will be nice to see which team member actually brought in the listing ... because team leaders like to reward agents who bring in business"
"As a team leader, I would find it useful to know how much money I am netting from each team member"
Team leaders needed:
- Individual agent contribution metrics
- Deal source attribution
- Commission split tracking
- Team member performance analytics
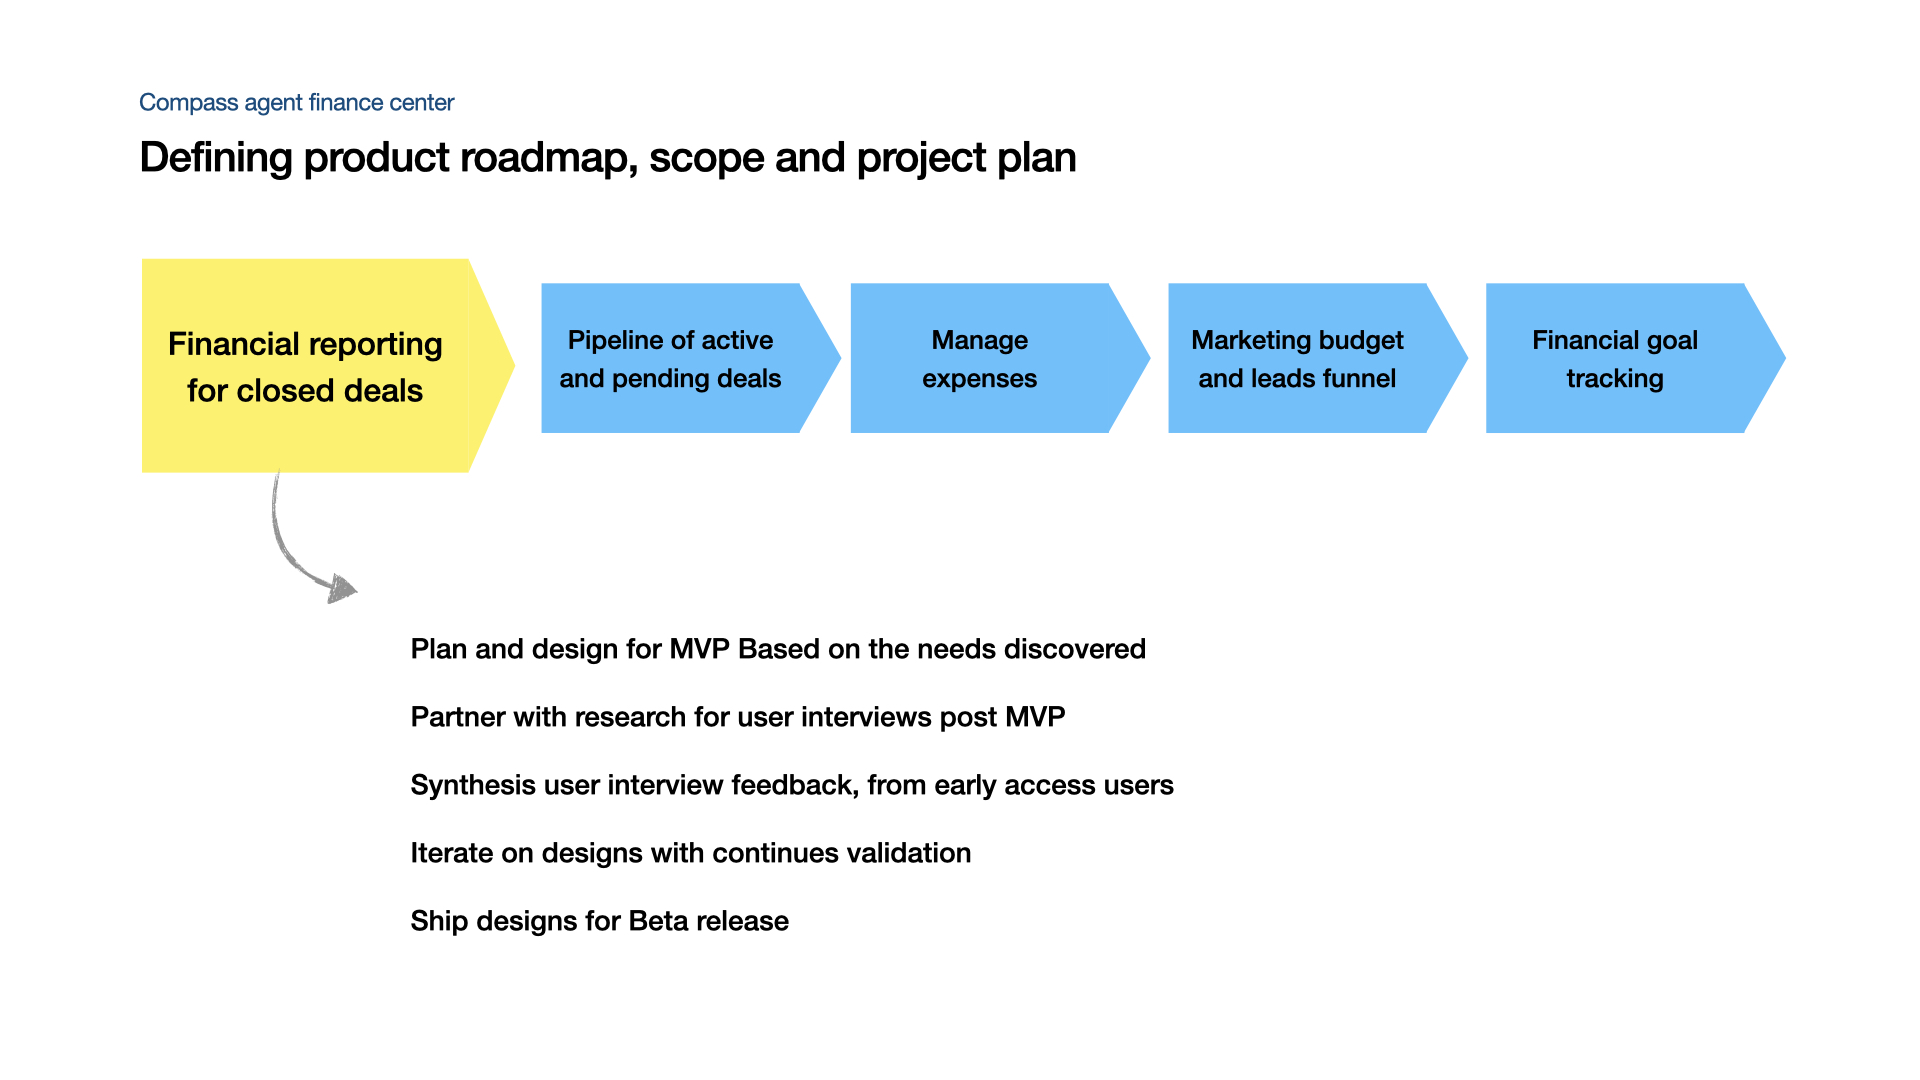
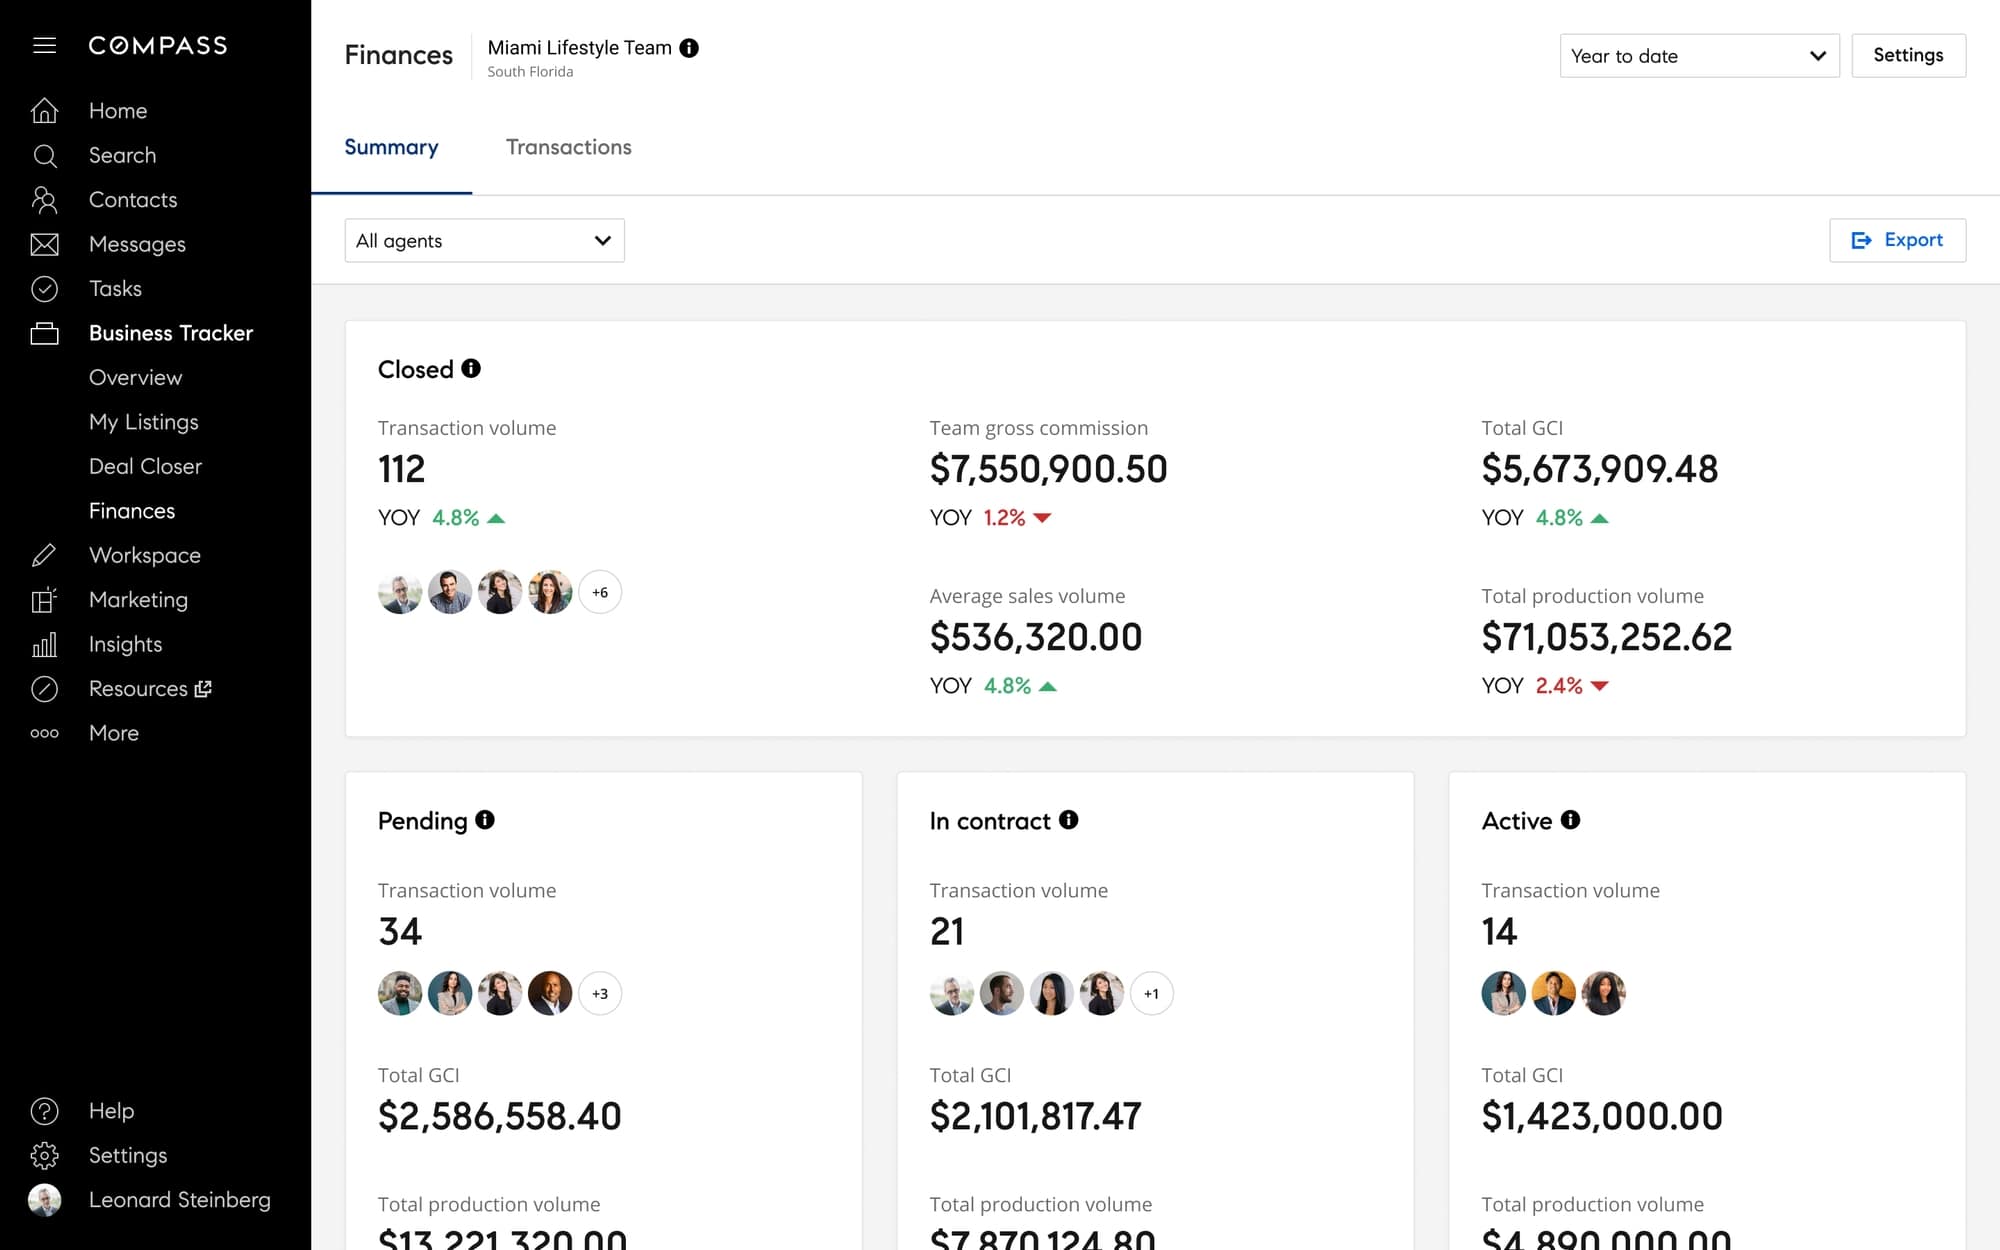
Solution
Built a comprehensive financial management platform that centralizes commission tracking, team performance analytics, and business planning. The system automates data collection and provides role-based access to financial insights.
Key Design Decisions
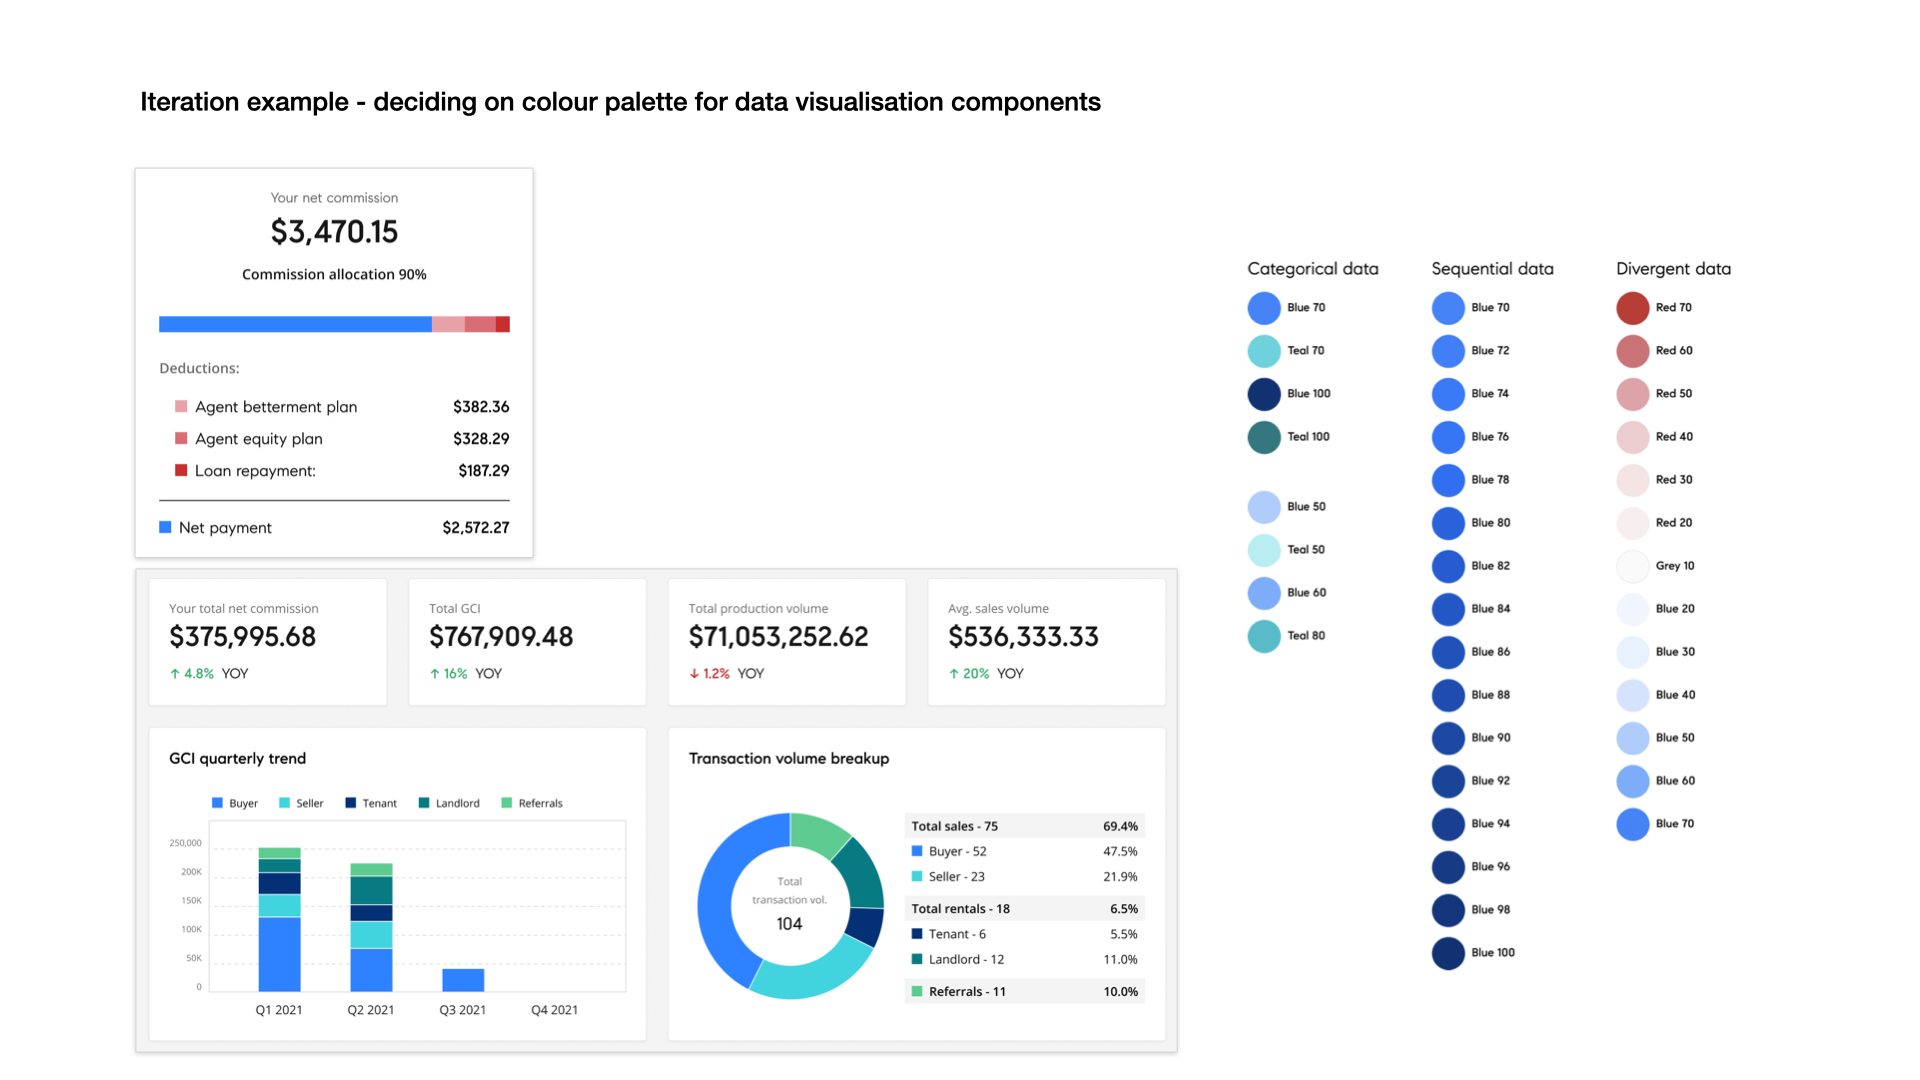
1. Data Visualization Color System
Created a systematic color palette optimized for financial data:
- Categorical Data: Blues (70-100) and Teals (70-100) for distinct categories
- Sequential Data: Monochromatic blues (70-100) for showing progression
- Divergent Data: Red (20-70) to Blue (20-70) spectrum for comparisons
- Ensured WCAG 2.1 AA compliance for all combinations
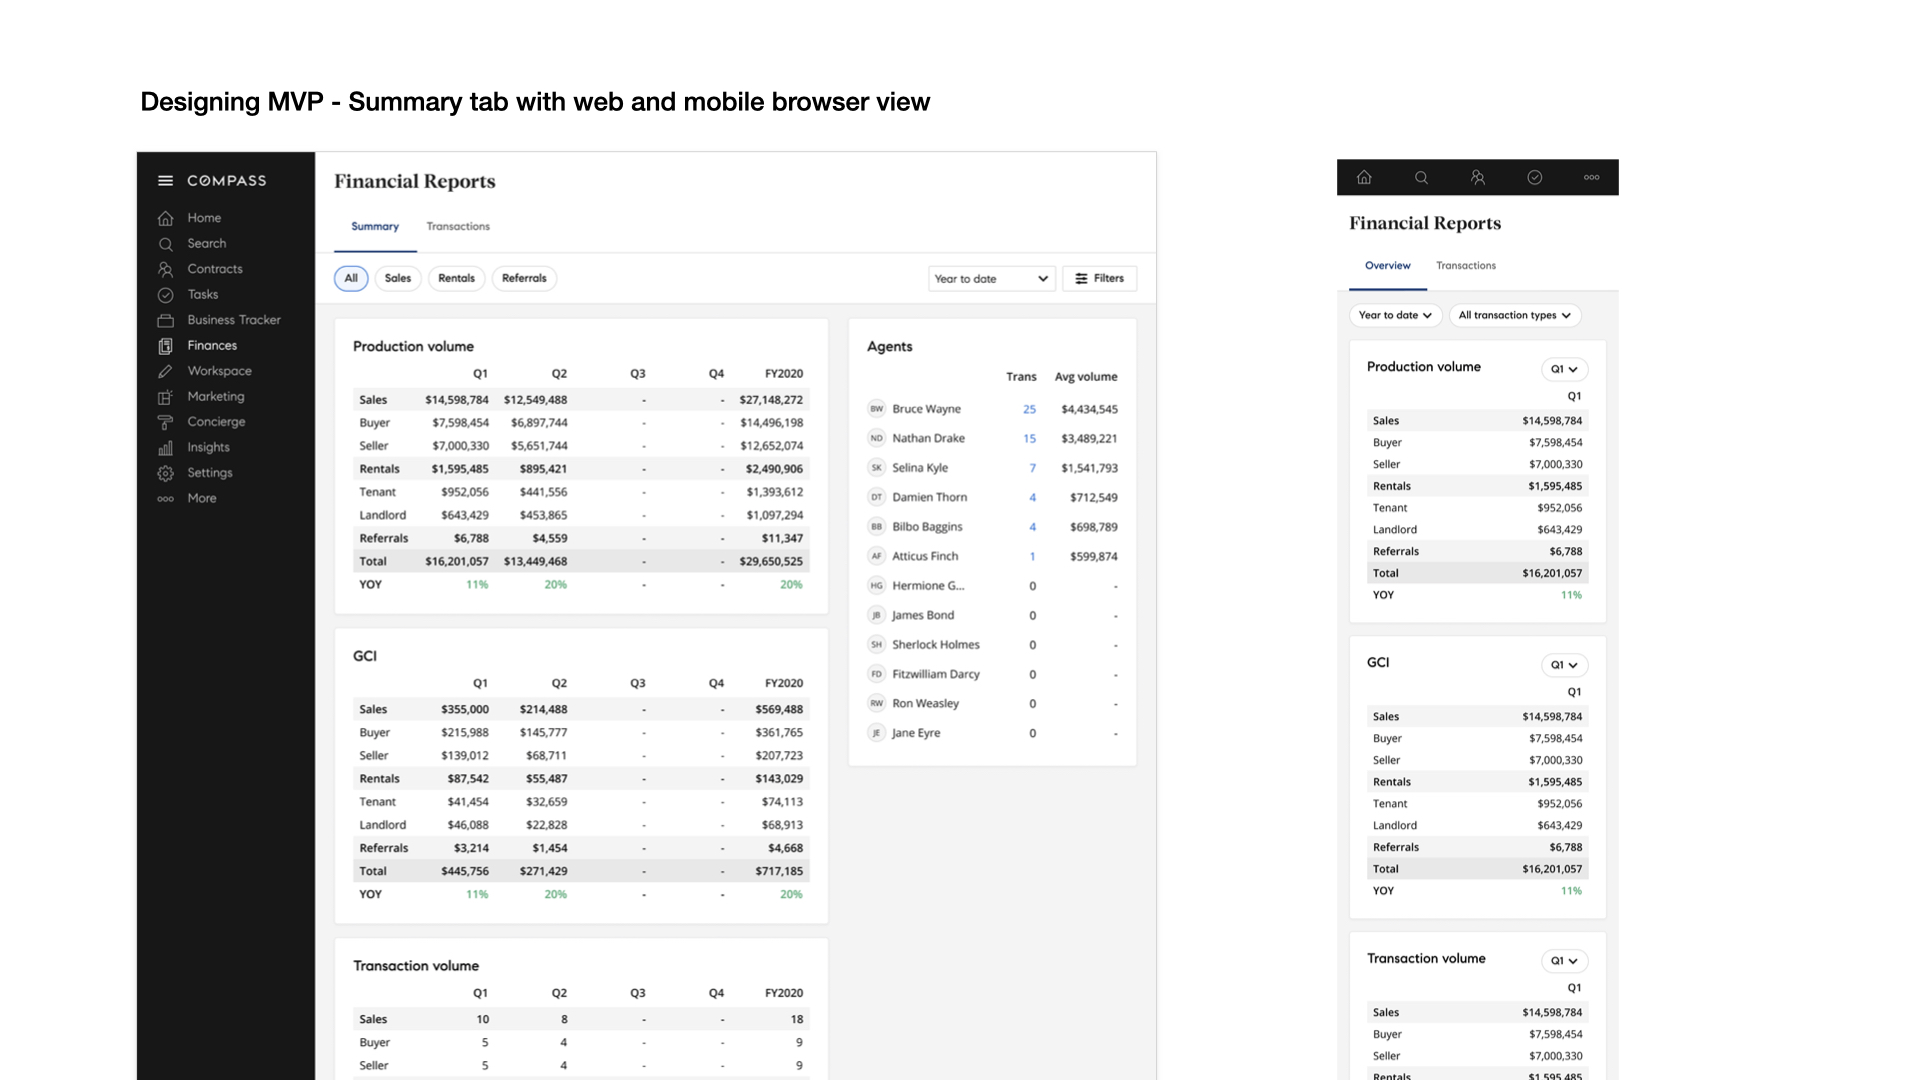
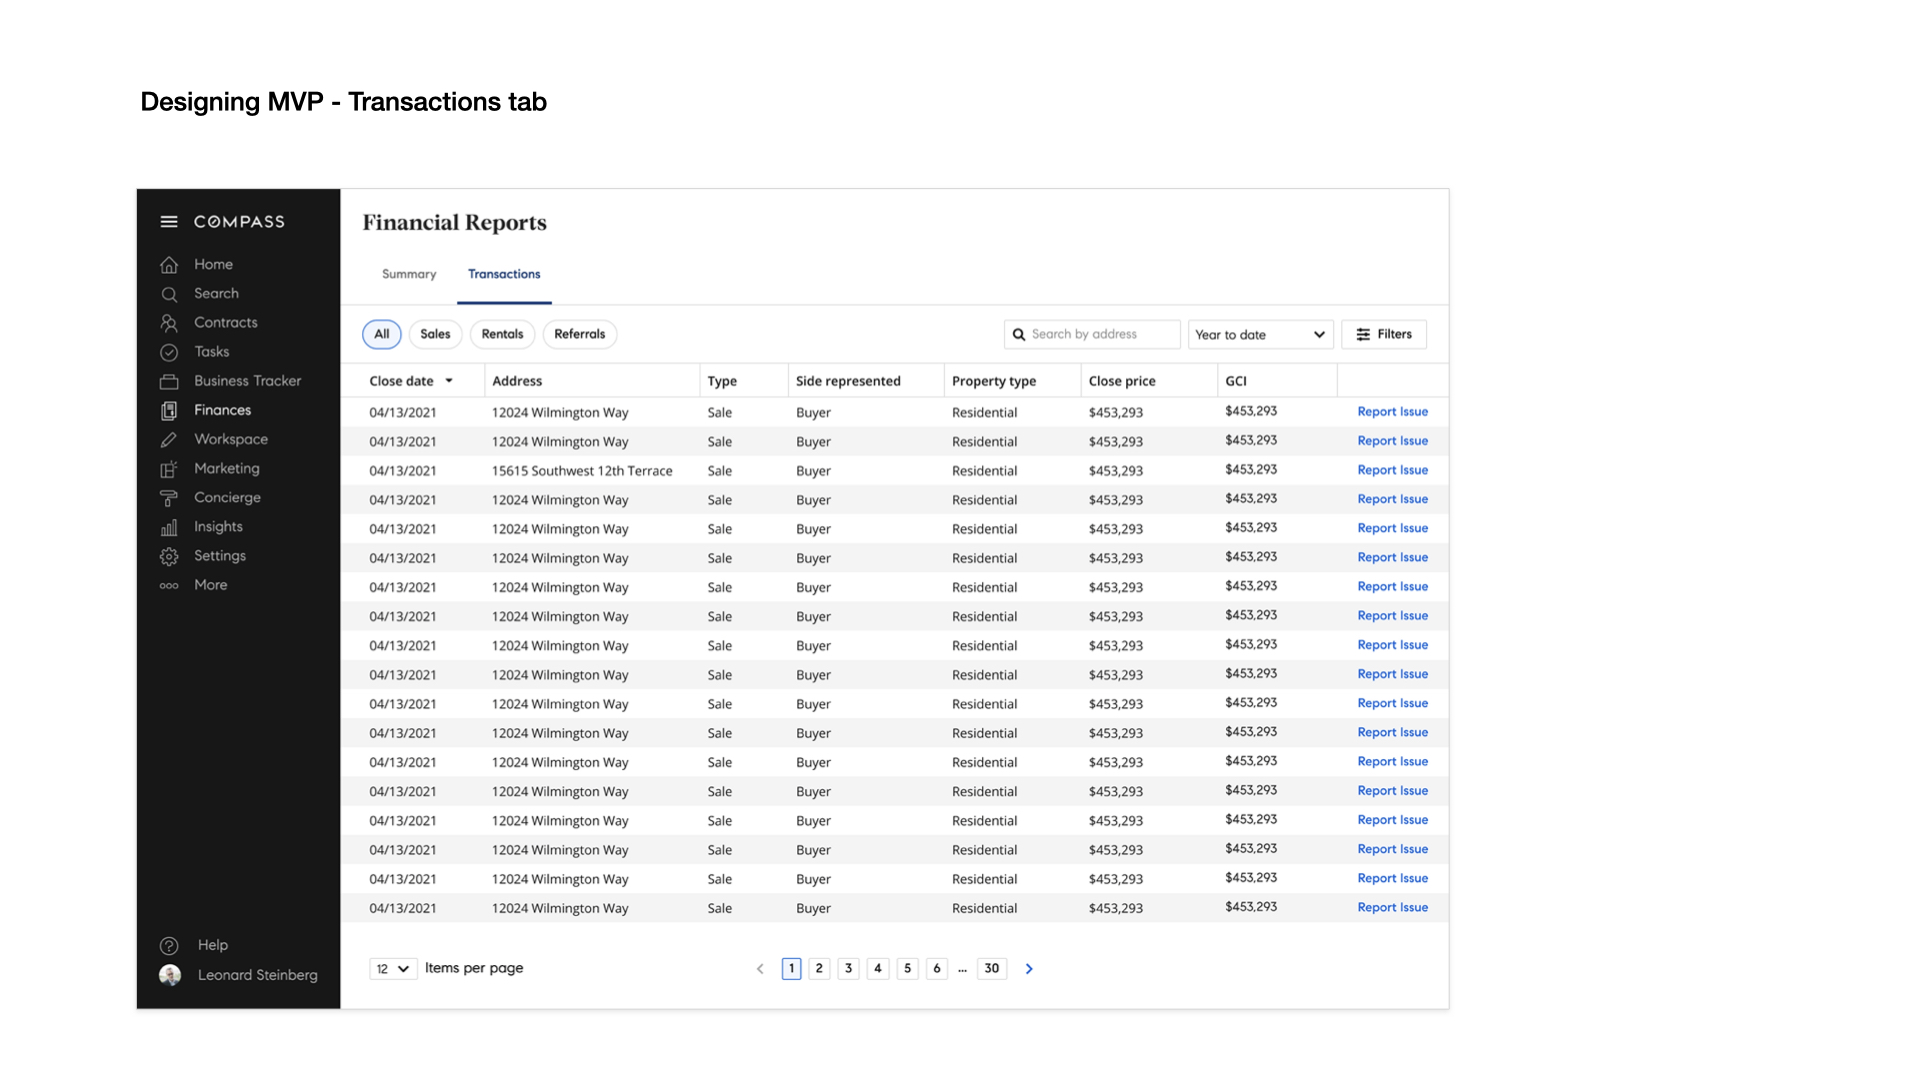
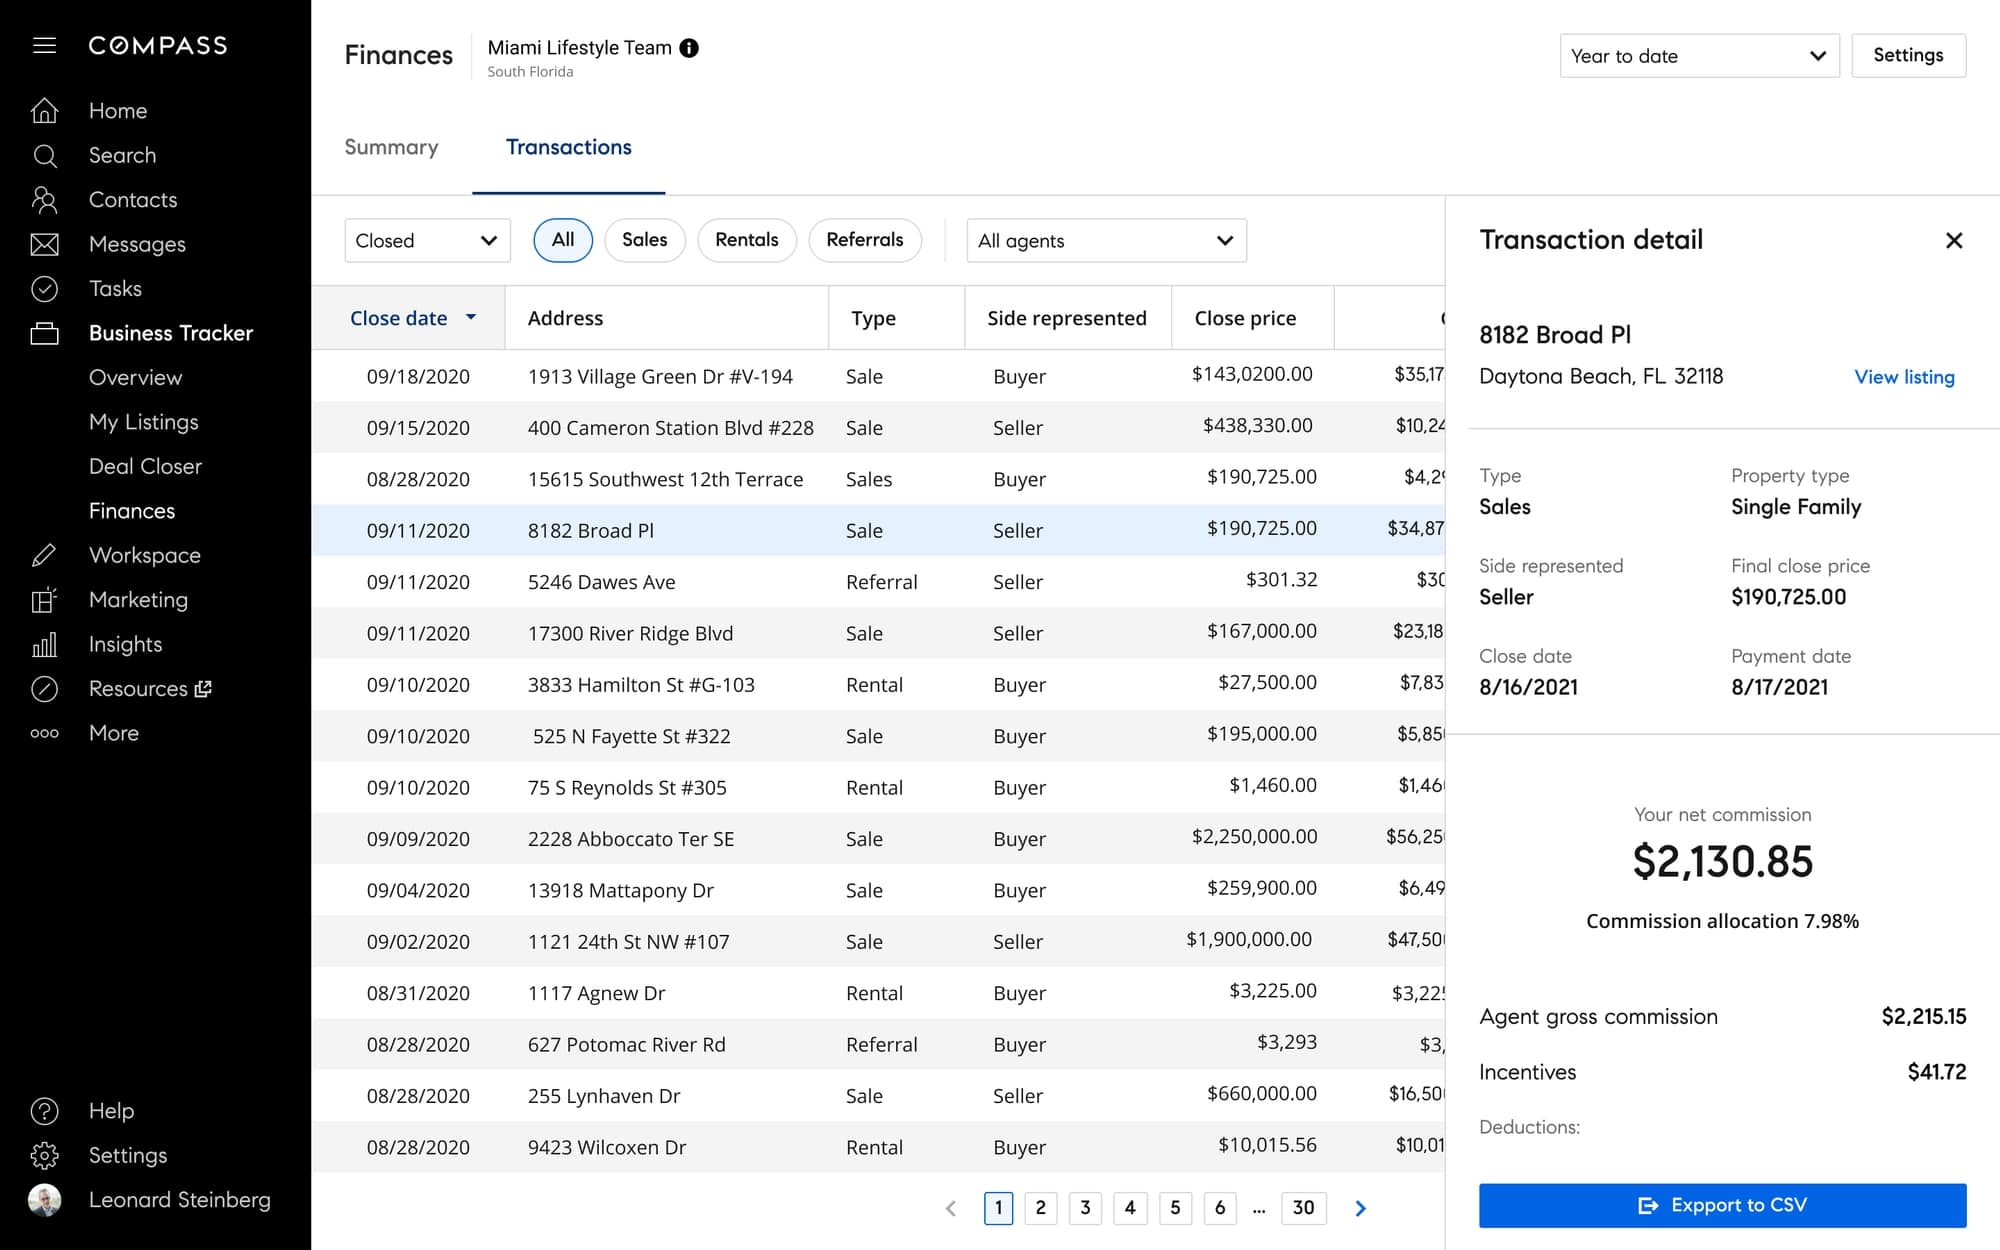
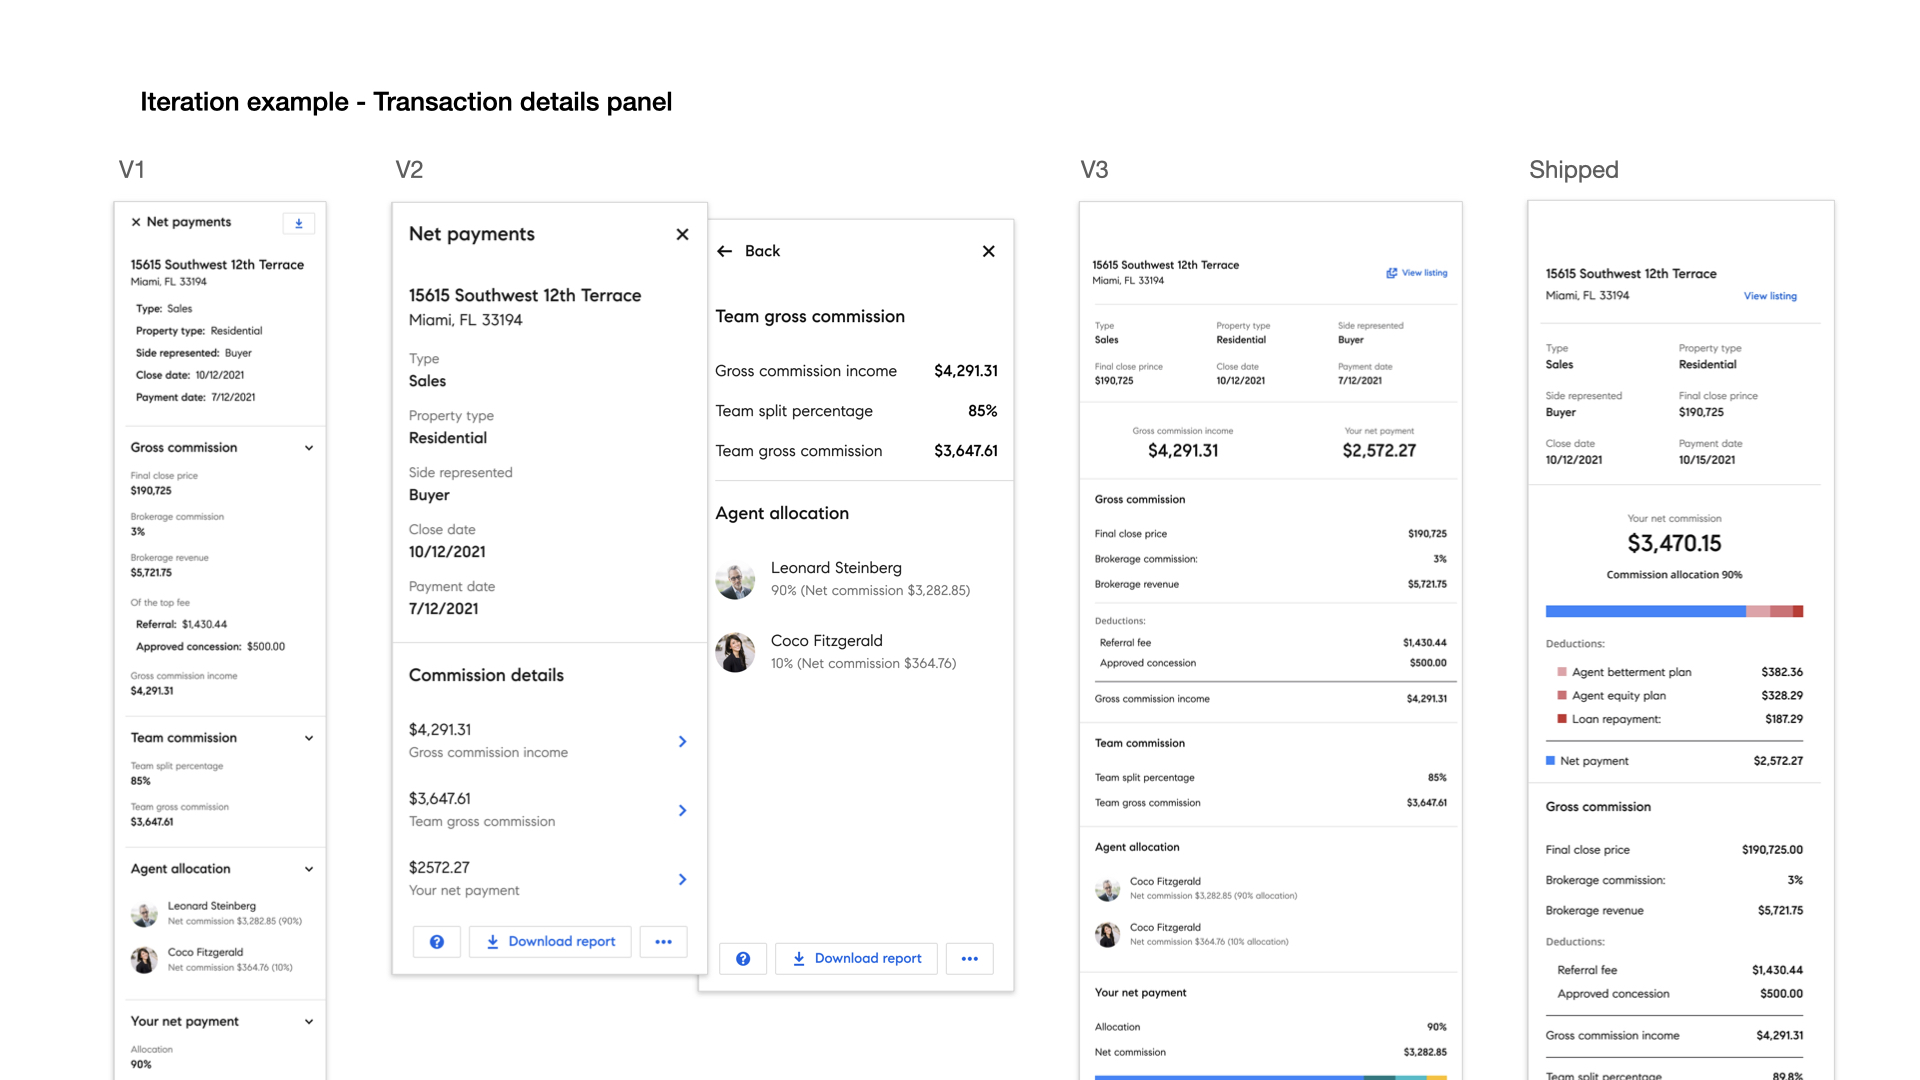
2. Transaction Details Panel
Optimized information hierarchy based on user research:
- Prominent display of net commission and allocation percentage
- Grouped deductions by type for quick scanning
- Clear visual separation between income and deductions
- Quick actions for common tasks
Outcome
Launch Results
- 23% agent adoption in launch regions
- 45% team adoption rate
- Significant reduction in third-party tool usage